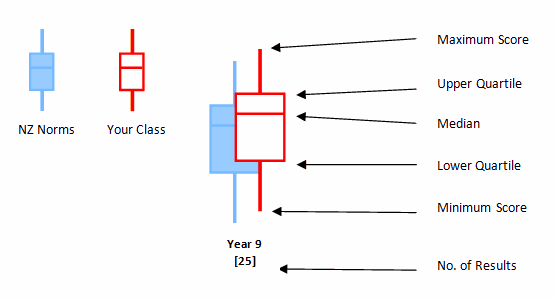
Refresher on box-and-whisker plots
Box-and-whisker plots are based on five score points. Imagine the scores in your group or class ordered from lowest to highest.
Components of a box-and-whisker graph
Whiskers:
- Minimum - the lowest score in the group.
- Maximum - the highest score in the group.
Box:
- Median - the middle score (note, this is not necessarily the average).
- Lower quartile - the score halfway between the minimum and median.
- Upper quartile - the score halfway between the median and maximum.
Box-and-whisker plots provide information about the centre of group achievement, as well as the spread.
The blue box-and-whiskers represent the e-asTTle norms.
The red box-and-whiskers represent your group. Always check the number in brackets – this shows you how many students have sat the test. The more students have taken the test, the more you can be confident that the box-and-whisker is a good reflection of your group.

When they cannot fit on the graph, extremely high or low scores display as arrows. You may notice that the tails on the blue box-and-whisker are very long for Reading and Maths – or represented as arrows. This is because e-asTTle tests have been sat by many, many students, so the highest and lowest possible scores are very spread out. You may wish to refer to the Tabular Report to identify which students have the very high or low scores.
- Related information

