Constructing the e-asTTle writing scale
The e-asTTle writing scale is based on an extension of the Rasch Measurement Model (RMM). Used widely in educational measurement, the RMM is a mathematical model that can be used to transform ordinal observations (such as rubric scores) into linear measures. The RMM predicts the probability of a test taker at a given proficiency level achieving success on a test item of known difficulty. Test-taker proficiency and item difficulty are assumed to be located on the same measurement scale and the probability of success on the item is a function of the difference between them.
The Multifacet Rasch Model (MFRM) extends the RMM by taking into account additional facets besides student proficiency and item difficulty that might be associated with the measurement context. In the context of a writing assessment, these include marker severity and the difficulty of the prompt.
To develop the e-asTTle writing scale, an MFRM was constructed that included:
- student writing proficiency
- the difficulty of the prompts to which the students were writing
- the difficulty of the elements against which the students’ written responses were being judged
- the thresholds or barriers to being observed in a scoring category for an element relative to the scoring category below
- the harshness of the markers judging the students’ written responses.
The model assumes that all these facets can be measured on a single continuum (measurement scale) and that their locations on this continuum are used to determine the probability that a student will score in the higher of two adjacent scoring categories. Statistical and graphical fit indicators are used to study the extent to which prompts, markers, students and marking rubrics fit the MFRM.
To construct the measurement scale, student responses to 21 writing prompts were collected in a national trial involving approximately 5000 students from Years 1 to 10. The students involved were selected using a random sampling methodology, which is described in section 6.2. Care was taken so that all markers and prompts could be linked across the students involved. This meant that many of the students completed two prompts and that many of the responses were double-marked.
The markers involved in the trial were trained teachers or held relevant post-graduate degrees. Each marker attended a two-day training course at the start of the marking exercise. Marking was done in teams and moderation meetings were carried out on a daily basis. Data was entered and carefully validated before analysis of data was carried out using the computer program Facets (Linacre, 2010).
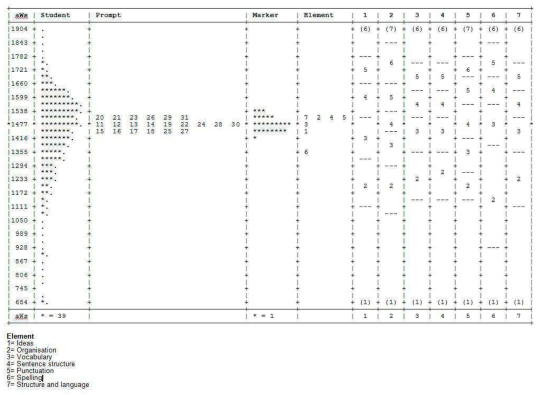
Figure 4
Figure 4 provides a graphical representation of the measurement scale constructed by the analysis process. The scale itself is presented on the left of the figure in e-asTTle writing scale units (aWs). The scale locations of students, prompts, markers, the elements of the rubric and the scale thresholds are displayed from left to right. As can be seen, these locations vary. Prompt 20, for instance, is located slightly higher on the scale than Prompt 27, indicating it was the more difficult of the two prompts. Similarly, some markers (indicated by asterisks) are higher on the scale than others, indicating they applied the rubric more harshly.
The final model for e-asTTle takes into account the scale locations of the prompts, elements, and thresholds shown in Figure 4 to transform students’ rubric scores to scale locations. Values for marker harshness are not included directly as there is no way to know how harshly a user may have marked. However, the variance in marker harshness exposed through the modelling process provides some idea of the imprecision markers introduce, and marker variance is included in the estimates of measurement error reported by the e-asTTle application for each scale score.
Further technical information can be found in Part B of the e-asTTle Writing manual.
- Related information


