Numeracy Project test reports
Two reports are available for numeracy tests – Tabular Report and Skyline Report.
Tabular Report
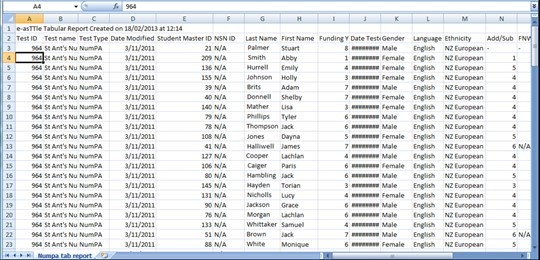
The Tabular Report is a .csv file listing your students, their demographic information, and the Numeracy Project stages.
You can view the Tabular Report in Excel. Tabular reports are available for single tests and multiple tests.
Skyline Report
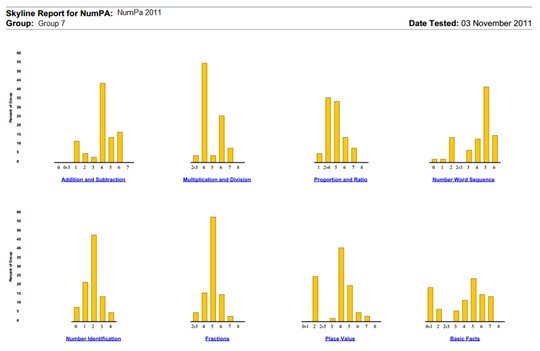
The Skyline Report is a series of bar graphs for each domain. This will show you how many students (and which students) are at each stage.
Skyline reports are available for single tests only.
Numeracy Tabular Report
Creating a Tabular Report
- Select "Create New Test"’ from left menu.
- Select "Numeracy Project".
- Select the check-box next to your test name, then select "Tabular Report".
You can create Tabular reports across multiple numeracy tests by clicking multiple check-boxes.
N/A represents either a data value not available or a domain not applicable for this test.
Skyline Report
Select the check-box next to your test name, then select "Skyline Report".
The Skyline Report is similar to the e-asTTle Curriculum Levels Report, but it reports against numeracy stages for each domain rather than curriculum levels.
Clicking on the domain links to the names of the students that have achieved in that stage. This is useful for grouping students by their achievement in each domain.
- Related information


