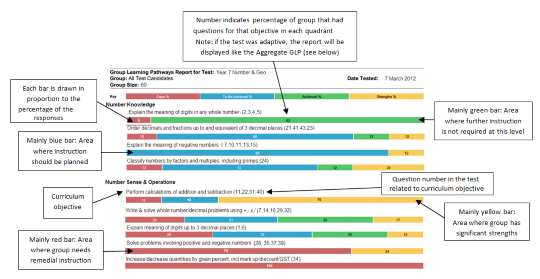
Group Learning Pathways (GLP) report
For the latest information using the upgraded e-asTTle tool, visit e-asTTle - Reports on Tāhūrangi.
This report addresses the question, “What are the strengths and weaknesses of my group?”
The "Group Learning Pathway" is a group summary of the "Individual Learning Pathway" reports.
The report is formatted as a horizontal cumulative bar graph. The graph shows the percentage of occasions that your students have Gaps, To Be Achieved, Achieved or Strength in questions within each curriculum objective.
Pay most attention to objectives where there are at least four questions. If an objective with less than four questions shows an interesting result, you may wish to create a new test focusing on that strand. This will provide you with a more robust estimate of student ability in that strand.
Aggregate (Multi-test) Group Learning Pathway Report
The most noticeable difference between the multi-test and the single-test version is that there are no question numbers. Instead, the aggregate report displays the total number of questions and total number of students related to each achievement objective bar. The bars, percentages and coloured sections can be interpreted in the same way as a single-test GLP report.
- Related information


