Progress Report
For the latest information using the upgraded e-asTTle tool, visit e-asTTle - Reports on Tāhūrangi.
This report addresses the question, “How are my students progressing?” Using this report you can track your students’ progress over time, including over schooling years. To get a Progress Report, you will need to use the check-boxes on the "View Reports" screen to select more than one test.
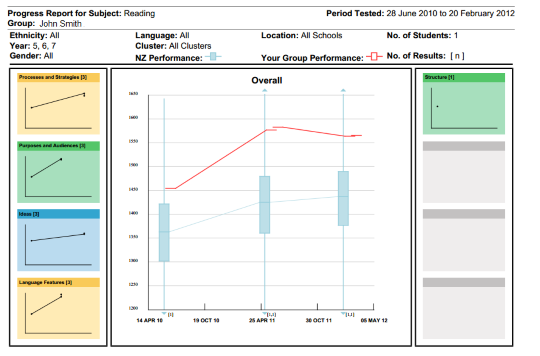
The Progress Report displays box-and-whisker plots showing the centre and range of students’ overall results. The box-and-whiskers plots are joined together with lines to indicate the rate of progress.
Refresher on box-and-whisker plots
Progress reports for individual students
Progress reports are primarily designed for groups. However, you can also generate Progress reports for individual students. Instead of a box-and-whisker, Progress reports for individual students just show a single red line graph. The best way to generate Progress reports for individual students is to use the Student Result Summary.
It is not expected that your Progress Report will be a smooth, upward line – progress is rarely this simple! However, over a year or so you should see upward progress.
"When I generate a Progress Report for my class, there are so many box-and-whiskers that it makes it difficult to see the actual progress. Is there some way that I can see my class progress on a term by term basis without so many box-and-whiskers?"
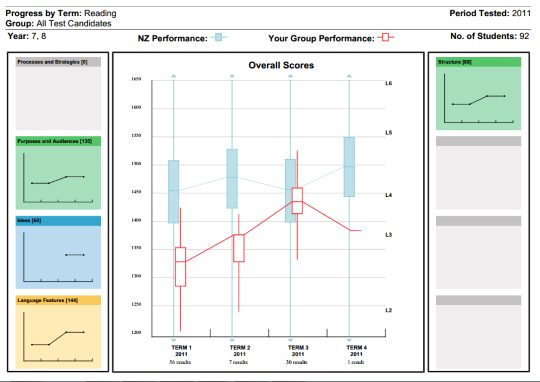
By selecting the Progress by Term report you will be able to see your class progress over time divided into term increments. Each term will have one red box-and-whisker which represents the aggregated scores from all the tests that your class sat in that term.
Progress – Comparisons reports
This is a variation of the Progress Report that allows you to compare the progress of certain cohorts of students with those of equivalent gender, ethnicity, or language (“like with like”). This report addresses the questions, “How are students of a specific gender, ethnicity and/or language progressing, compared to similar students in New Zealand?” and “How are my students progressing compared to those in similar schools?”
In this report, only the groups you selected are included in the report and e-asTTle norms refer to only students of your chosen group. For example, you could compare your Year 6 male students with the e-asTTle norms for Year 6 males.
This report indicates that if your groups’ results are below average, that performance is not due to group membership, as similar students in other schools are performing better than your sample. It may be that the difference is due to instructional experience.
Remember to take into account the number of students in your group with these attributes. If your group is small, interpret your results with caution. Smaller groups are more likely to be significantly different from the e-asTTle norm by chance.
Your school is assigned one of 20 e-asTTle clusters, based on its location, decile, type and size. Using the "Schools Like Mine" option will show your students’ performance compared to students in your e-asTTle cluster. The report header shows which cluster your school is assigned to.
Progress by Term reports
The Progress by Term is similar to the Progress Report, but it aggregates all results from all tests that were sat within one school term. Each term on the report will have one box-and-whisker representing the combination of results. The right-hand y-axis displays the e-asTTle levels, which correspond to the scores on the left-hand y-axis.
This report is only available if the tests you selected were sat within a 15-month period.
Use caution when interpreting reports with few results. In the graph above, the 2nd box-and-whisker only has seven results, and the final box-and-whisker only has one result.
- Related information


