Target setting
Why use target setting?
Targets help you focus on important areas. They enable you to set expectations for you and your students.
As part of planning students’ pathways for learning, Senior management may use target setting for strategic planning, allocating resources, planning professional development, or working with teachers about year level expectations.
Things to keep in mind when setting targets
Consider targets against curriculum-expected spread of e-asTTle norms and student’s projected e-asTTle achievement.
Remember variability within classes exists. By setting targets in collaboration with your students, you can agree on challenging yet achievable targets for each individual.
Be realistic. Targets that are too difficult may demotivate your students
Be clear what your time period for achieving a target is.
As target setting is an imperfect process, you need to monitor performance over time, to ensure that your targets are appropriately challenging and realistic.
Do not set too many targets for an individual student.
While setting the target is beneficial, maintain focus with students on what they should be doing to achieve the target. What are they doing well? Where do they need to improve? What next steps can they take?
Setting targets
To select targets, follow these steps.
- Select "Manage Students" from left menu.
- Select "Set Targets for Students".
- Use drop-downs to select Subject and Group.
- Select students.
- For one student, select the student’s name, then select "Add".
- For multiple students, hold down <CTRL> key, select the students, then select "Add".
- To select all students, select "Add All".
- You can remove students by selecting the students, then selecting"Remove" or "Remove All".
- Select Target From box and use calendar to select date.
- All the students’ existing test results and targets from this date will be shown on the next screen.
- Students must be at least Year 1 at the date you choose.
- Note - target dates must be set to after re-calibration dates (Mathematics – 18/09/2010; Reading – 24/04/2010).
- Select "Projected To" box and use calendar to select the date you wish to set targets for.
- All students must be between Years 4–12 at projected dates.
- Make sure the dates are in the future.
Interpreting the Target Setting Graph and Date Table
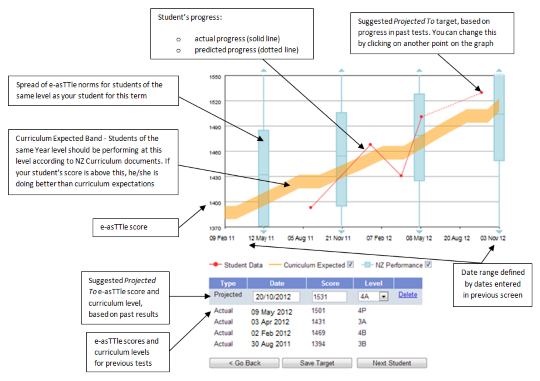
In this screenshot of a Target Setting Graph and a Date Table, key parts of each are explained in boxes that have an arrow pointing to the feature.
Text version – has a text version of the Target Setting Graph and Data Table.
If your student’s results differ greatly from e-asTTle norms, the box-and-whisker plot may not show up.
You can add/remove Curriculum Expected band and/or box-and-whisker plots. To add, tick the box in the graph legend. To remove, untick the box.
Refresher on box-and-whisker plots – explanation of box-and-whisker plots.
Curriculum Expected Band
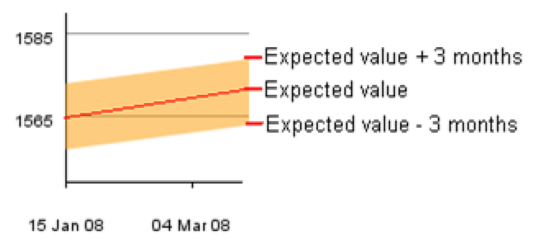
Curriculum Expected is plotted as an orange band.
The red line is the expected score, the upper value is +3 months from this point, and the lower value is -3 months from this point.

Projected Targets
Student’s projected achievement is based on past rate of e-asTTle performance. e-asTTle uses a best-fit line to produce suggested targets when there are two or more actual scores.
In cases where there is only one existing score, suggested targets are calculated based on the existing score and average progression. In the absence of recorded scores, the e-asTTle norm for year level and term is used.
While e-asTTle suggests a projected target, ultimately the target should be agreed upon between you and your student.
Why does my suggested target appear to be decreasing?
In some cases, your student may have performed below their normal e-asTTle performance. As a result, this causes the best fit line to decrease. You can change the projected target by clicking on another point on the graph.
Setting/Changing/Deleting Projected Targets
If you are happy with the suggested Projected Target, select "Save Target".
If you are unhappy with the suggested Projected Target, you can change it to better correspond with one you wish to set. There are three ways you can do this.
Re-position the Projected To data-point
Re-position the Projected To data-point by clicking another point on the graph. This will automatically change the relevant fields in the data table.
Select "Save Target".
Change value in the Projected Level
Changing the value in the Projected Level field, automatically moves the data-point to a new position.
Select "Save Target".
Change the number in the Projected Score.
Change the number in the Projected Score Field
Changing the number in the Projected Score field automatically moves the data-point to a new position.
Select "Save".
Deleting a target
To delete a target select "Delete" link next to the projected target you wish to remove.
A prompt will appear. Select "OK" to confirm, otherwise select "Cancel".
To move to the next student, click "Next Student" or select the student whose targets you wish to view from the top-right drop-down.
Make sure you set your projected targets in the future.
Viewing Targets
You can view targets by following these steps.
- Select "View Targets for Students".
- Use drop-downs to select Subject and Group.
- Select students:
- for one student, click the student’s name, then click "Add"
- for multiple students, hold down <CTRL> key, click on students, then click "Add"
- to select all students, click "Add All"
- you can remove students by clicking on the students, then clicking "Remove" or "Remove All".
- Use calendar in Target Set Between fields to select dates.
- All existing targets in this date range will be shown on reports.
- You can include targets set in the past and future.
- Select "Target Report".
Target Setting Graphs and Reports
The two types of graphs and reports you can view are:
- less than sixty days between Target From and Projected To dates
- more than sixty days between Target From and Projected To dates.
The type you choose will depend on the range of days between Target From and Projected To dates you want to generate.
<60 days between Target From and Projected To dates
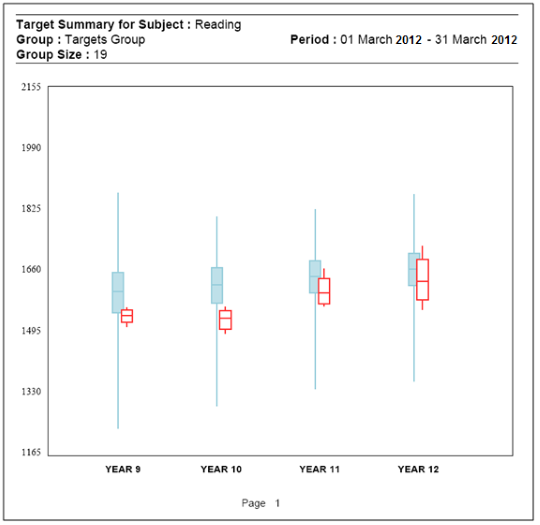
This graph shows targets in a box-and-whisker plot, for each selected year level.

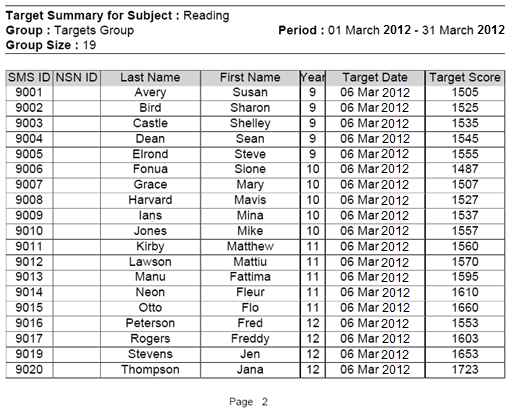
The report shows target dates and scores of individual students in your group.

>60 days between Target From and Projected To dates
This graph shows targets in a box-and-whisker plot for each selected year level.
Each year level shows box-and-whisker plots for multiple targets over time in its own graph. The report shows the multiple target dates and scores of individual students in your group.
The report shows the multiple target dates and scores of individual students in your group. By selecting a time period spanning over a year, only the graph will be available; the graph will not appear.
Because the x and y-axis for each graph are the same, you can make direct comparisons between years.
About direct comparisons
- You can see multiple year levels but not the groups within these levels.
- The red box-and-whiskers represent your students’ targets.
- The blue box-and-whiskers show the e-asTTle norms for the same period.
- If one student has multiple targets within the timeframe, they are included as if they were individual students – individual targets are not averaged.
Refresher on box-and-whisker plots – provides guidance on intepreting box-and-whisker plots.
- Related information


